• Simulacra and Simulation

    openrazer


    I have a razer keyboard with separate LEDs for each key, and was curious whether I can address them using Python. As it turns out, there is linux driver and python library that makes it possible. I do not have specific usecase in mind, it could be useful for displaying notifications or progress bar — or perhaps something else entirely.


    The setup is relatively straightforward. I just had to install the driver: https://openrazer.github.io/#download. They are kind enough to provide some examples: https://github.com/openrazer/openrazer/blob/master/examples/custom_zones.py

    I changed the example a little to display the current outside temperature using LEDs placed on function row:

    import time
    from openrazer.client import DeviceManager
    from pyowm.owm import OWM
    
    # Create a DeviceManager. This is used to get specific devices
    device_manager = DeviceManager()
    
    print("Found {} Razer devices".format(len(device_manager.devices)))
    
    devices = device_manager.devices
    
    for device in devices:
        if device.fx.advanced and device.name == "{{your keyboard}}":
            keyboard = device
            print("Selected device: " + device.name + " (" + device.serial + ")")
            break 
    
    if not keyboard:
        print("No suitable device found.")
    
    # Disable daemon effect syncing.
    # Without this, the daemon will try to set the lighting effect to every device.
    device_manager.sync_effects = False
    
    # Replace with your OpenWeatherMap API key
    api_key = "{{redacted}}"
    owm = OWM(api_key)
    
    # Get weather for a specific location
    city = "Wroclaw"
    mgr = owm.weather_manager()
    observation = mgr.weather_at_place(city)
    
    while True:
        weather = observation.weather
        buttons_to_light = round(weather.temperature('celsius')['temp'])
    
        for i in range(0, buttons_to_light):
            keyboard.fx.advanced.matrix[0,1+i]=(0,0,255) 
        keyboard.fx.advanced.draw()
        time.sleep(60)

    Another example, displaying server load, fetching it first from prometheus database:

    import time
    from openrazer.client import DeviceManager
    import requests
    
    # Create a DeviceManager. This is used to get specific devices
    device_manager = DeviceManager()
    
    print("Found {} Razer devices".format(len(device_manager.devices)))
    
    devices = device_manager.devices
    
    for device in devices:
        if device.fx.advanced and device.name == "{{your keyboard}}":
            keyboard = device
            print("Selected device: " + device.name + " (" + device.serial + ")")
            break 
    
    if not keyboard:
        print("No suitable device found.")
    
    device_manager.sync_effects = False
    
    # Define the Prometheus server URL and query
    prometheus_url = "http://192.168.1.43:9999/api/v1/query"
    query = "node_load5{instance='fedora-1.home'}"
    
    while True:
        response = requests.get(prometheus_url, params={"query": query})
        data = response.json()
        result = data["data"]["result"]
        timestamp, value = result[0]["value"]
        load = round(float(value))
    
        for i in range(0, load):
            keyboard.fx.advanced.matrix[0,1+i]=(255,0,0) 
        keyboard.fx.advanced.draw()
        time.sleep(60)
    +
  • Simulacra and Simulation

    traefik middleware examples

    Traefik middleware is a component, that allows to modify http requests before passing it to the service. There are different usecases for the middleware:

    • redirect
    • rewrite
    • security, like basic auth
    • rate limiting

    Let me show how to implement basic traefik middleware.

    redirect

    apiVersion: traefik.io/v1alpha1
    kind: Middleware
    metadata:
      name: redirect
      namespace: home
    spec:
      redirectRegex:
        regex: "^https://piasecki\\.it/$"
        replacement: "https://piasecki.it/?effect=mirror&camera=true"
        permanent: false

    This resource will redirect from https://piasecki.it/ to https://piasecki.it/?effect=mirror&camera=true . To use it, you need to modify ingress, by adding home-redirect@kubernetescrd to traefik.ingress.kubernetes.io/router.middlewares annotation.

    apiVersion: networking.k8s.io/v1
    kind: Ingress
    metadata:
      annotations:
        cert-manager.io/cluster-issuer: letsencrypt-prod
        spec.ingressClassName: traefik
        traefik.ingress.kubernetes.io/router.middlewares: cert-manager-redirect-https@kubernetescrd,home-redirect@kubernetescrd

    In the effect, ?effect=mirror&camera=true will be added to user request, whenever he will visit https://piasecki.it/ . It is possible to do the same thing, but transparently for the user by using rewrite.

    Rewrite

    apiVersion: traefik.io/v1alpha1
    kind: Middleware
    metadata:
      name: rewrite
      namespace: home
    spec:
      replacePathRegex:
        regex: "^/$"
        replacement: "/?effect=mirror&camera=true"

    It should work. But it did not. What the backend received was

    10.42.0.36 - - [16/Nov/2024 12:30:03] "GET /%3Feffect=mirror&camera=true HTTP/1.1" 404 -

    ? was encoded to %3F and it resulted with 404 error.

    There are a few solutions, but they require working with backend.

    • correct path parsing
    • parsing custom headers

    I guess I will stick with the redirect then.

    +
  • Simulacra and Simulation

    WordPress backup, restore and upgrade

    WordPress is a highly popular content management system, with some estimates suggesting it powers over 40% of all websites. However, its popularity also comes with a significant list of vulnerabilities. Hosting an outdated wordpress instance is practically an open invitation to potential attackers.

    Because my wordpress instance is containerized, and how wordpress manages database schema upgrades, this procedure is little complicated. Here are the steps for testing it using another instance.

    • backup the database
    • spawn new instance
    • restore from backup
    • manual upgrade from the UI
    • upgrade using helm. This step is crucial, without it upgrade would be reverted after next pod restart

    If that is working, I will repeat those steps on “production” instance.

    BackuP

    There a few different options for the backup:

    • All-in-One WP Migration – done from the UI
    • wp db export – CLI from container
    • mysqldump – CLI, can be executed from anywhere, best for the automation

    creating new instance

    Now install the old version, in my case

    helm install dev-wordpress oci://registry-1.docker.io/bitnamicharts/wordpress --version=23.1.15 --set wordpressPassword=dupa,service.type=NodePort

    password does not matter, as it will be just an internal instance

    now check the http nodeport

    kubectl get svc dev-wordpress -n dev-wordpress -o json | jq -r '.spec.ports[] | select(.name == "http") | .nodePort'

    and connect to the instance using url:{{nodeIP}}:{{port}}/wp-admin/

    Restore

    Restore the database using any method mentioned before

    Manual upgrade from the ui

    Because wordpress is not using database migrations like Django, we need to trigger it manually. Easiest would be manual upgrade from the UI.

    Upgrade helm release

    Assuming the previous steps have been successful, we can now upgrade the Helm release. Begin by preparing the values for the Helm chart:

    mariadb:
      auth:
        rootPassword: vNjjzlEAuY
    wordpressUsername: {{user}}
    wordpressPassword: "{{password}}"

    You can get current db password using echo $(kubectl get secret --namespace "dev-wordpress" dev-wordpress-mariadb -o jsonpath="{.data.mariadb-root-password}"
    | base64 -d)

    check if everything is working with

    helm upgrade dev-wordpress oci://registry-1.docker.io/bitnamicharts/wordpress -f dev-values.yaml --dry-run 


    If so, execute without --dry-run.

    In my case, it __almost__ worked

    helm upgrade dev-wordpress oci://registry-1.docker.io/bitnamicharts/wordpress -f dev-values.yaml                                          
    WARNING: Kubernetes configuration file is group-readable. This is insecure. Location: /home/orest/.kube/config
    WARNING: Kubernetes configuration file is world-readable. This is insecure. Location: /home/orest/.kube/config
    Pulled: registry-1.docker.io/bitnamicharts/wordpress:24.0.4
    Digest: sha256:ee46617e6025d94ec2686dc909224ebe300275e76bf4cf2e3268925d7040077b
    Error: UPGRADE FAILED: cannot patch "dev-wordpress-mariadb" with kind StatefulSet: StatefulSet.apps "dev-wordpress-mariadb" is invalid: spec: Forbidden: updates to statefulset spec for fields other than 'replicas', 'ordinals', 'template', 'updateStrategy', 'persistentVolumeClaimRetentionPolicy' and 'minReadySeconds' are forbidden
    

    stateful set was not upgraded. I will leave it now, hopefully it will not backlash later. I will probably create external DB later.

    Now switch off dev instance:

    kubectl scale deployment dev-wordpress --replicas=0 
    kubectl scale statefulset dev-wordpress-mariadb --replicas=0

    and patch the “production”.

    +
  • Simulacra and Simulation

    Etcd backups

    Etcd is key value data store. It is used as default database to store cluster state in kubernetes. You can find there information like connected nodes or deployed resources. Etcd can be deployed in high availability mode. When one of the etcd nodes is down, the rest will elect next leader. But to have it working, you need odd number of nodes. Etcd synchronously replicates the data across all of the nodes, in order to maintain consitency.

    Most k8s distributions is shipped with etcd preinstalled by default. However, k3s uses sqlite. For development purposes, sqlite is good enough. But if you want to mimic production environment, I would switch to etcd. In k3s it can be done by editing /etc/systemd/system/k3s.service and adding --cluster-init to ExecStart:

    ExecStart=/usr/local/bin/k3s \
        server --disable traefik \
        --cluster-init

    next

    sudo systemctl daemon-reload 
    sudo systemctl restart k3s.service   

    after the restart, there will be two opened ports:

    sudo netstat -tulpn | grep -E '2379|2380'                                                                                                  
    tcp        0 192.168.1.43:2380       0.0.0.0:*        LISTEN      2266838/k3s server
    tcp        0 192.168.1.43:2379       0.0.0.0:*        LISTEN      2266838/k3s server
    tcp        0 127.0.0.1:2379          0.0.0.0:*        LISTEN      2266838/k3s server
    tcp        0 127.0.0.1:2380          0.0.0.0:*        LISTEN      2266838/k3s server

    2379 is for client communication (like k8s api, or etcdctl), second is for internal peer2peer communication.

    Lets connect to the DB and investigate the content

    sudo ETCDCTL_ENDPOINTS='https://127.0.0.1:2379' ETCDCTL_CACERT='/var/lib/rancher/k3s/server/tls/etcd/server-ca.crt' ETCDCTL_CERT='/var/lib/rancher/k3s/server/tls/etcd/server-client.crt' ETCDCTL_KEY='/var/lib/rancher/k3s/server/tls/etcd/server-client.key' ETCDCTL_API=3 etcdctl get / --prefix --keys-only

    Command is quite long, because we need to supply CACERT, client cert and client key. It will show all the keys in DB. The key is needed, because etcd include sensitive data like cluster secrets.

    Because etcd reflects current state of the cluster, it is best option for creating backups. Theoretically, you can run something like:

    kubectl get all -A > backup.yaml

    but you need to add crds, configmaps, secrets, roles, role bindings, cluster roles, cluster role bindings, namespaces, storages and ingresses. And after that, there is a chance, the backup will not be consistent.

    Much better option is either:

    k3s build in mechanism: sudo k3s etcd-snapshot save --name {{name}}. You can list them by either sudo k3s etcd-snapshot list:

    Name                        Location                                                                    Size     Created
    a-fedora-1.home-1731606336  file:///var/lib/rancher/k3s/server/db/snapshots/a-fedora-1.home-1731606336  57872416 2024-11-14T18:45:36+01:00
    19-fedora-1.home-1731607482 file:///var/lib/rancher/k3s/server/db/snapshots/19-fedora-1.home-1731607482 60571680 2024-11-14T19:04:42+01:00
    19-fedora-1.home-1731607495 file:///var/lib/rancher/k3s/server/db/snapshots/19-fedora-1.home-1731607495 60571680 2024-11-14T19:04:55+01:00

    or kubectl get etcdsnapshotfile.

    kubectl get etcdsnapshotfile -o custom-columns="NAME:.metadata.name,SIZE:.status.size"                                                                                                                                                                                                         
    NAME                                       SIZE
    local-19-fedora-1.home-1731607482-a134be   60571680
    local-19-fedora-1.home-1731607495-4ec46a   60571680
    local-19-fedora-1.home-1731607502-b86a8f   60571680
    local-19-fedora-1.home-1731607509-1ce0fa   60571680
    local-19-fedora-1.home-1731607518-a5c0f5   60571680
    local-a-fedora-1.home-1731606336-3a1503    57872416
    local-a-fedora-1.home-1731620822-e70700    60571680

    Snapshot schedule can be configured by editing "/etc/rancher/k3s/config.yaml, it can look like this:

    # Enable etcd snapshot backup
    etcd-snapshot-schedule-cron: "0 */6 * * *"
    etcd-snapshot-retention: 100
    etcd-snapshot-compress: true
    etcd-snapshot-dir: "/var/lib/rancher/k3s/server/db/snapshots"
    etcd-snapshot-name: "k3s_etcd_snapshot"

    Another method, independent of k3s toolset is:

    sudo ETCDCTL_ENDPOINTS='https://127.0.0.1:2379' ETCDCTL_CACERT='/var/lib/rancher/k3s/server/tls/etcd/server-ca.crt' ETCDCTL_CERT='/var/lib/rancher/k3s/server/tls/etcd/server-client.crt' ETCDCTL_KEY='/var/lib/rancher/k3s/server/tls/etcd/server-client.key' ETCDCTL_API=3 etcdctl snapshot save {{path}}

    It is much more generic, and closer to k8s.

    tldr; consider creating backups, both of etcd and persistent volumes.

    +
  • Simulacra and Simulation

    traefik + dashboard

    In k3s, traefik is the default ingress controller. It handles incoming HTTP and HTTPS requests and routes them to correct services. If you have multiple domains, subdomains, or need to route different paths to different services, Traefik is an excellent choice.

    Traefik is a reverse proxy, meaning it is acts as a backend server for the end user, routing client requests to the appropriate services.

    In contrast, a forward proxy acts on behalf of the client, typically for privacy or content filtering.

    There are various of choices for reverse-proxy and ingress controllers for k8s.

    Among them nginx and traefik are most common choices. Both of them supports advanced routing, SSL termination and WebSockets. The key differences are:

    • traefik was designed as a cloud-native tool, whereas nginx has a long history of general-purpose web server
    • traefik is fully dynamic, and picks up the changes nearly instantly, while nginx requires reloading
    • traefik includes dashboard and prometheus integration out of the box, nginx requires additional setup for those features
    • the traefik documentation can be challenging to navigate, making the learning curve steeper compared to nginx.

    Other noteworthy ingress controllers:

    • HAProxy – for its high performance and advanced load-balancing capabilities, making it an excellent choice for handling heavy traffic
    • Istio – part of the Istio service mesh, ideal for managing advanced traffic in microservice architecture
    • AWS, GCP, Azure ingress controllers – integrates with their respective cloud resources, such as load balancers or application firewalls

    Before starting any traefik configuration, it is helpful to understand the key concepts.

    • entrypoint – a port that receives the traffic
    • router – connects requests from the entrypoint to the service. Can use middleware to modify the request, before passing to the service
    • rule – part of the router. Defines criteria to route requests to the appropriate service. Rule can evaluate headers, hostnames, paths, IPs, etc.
    • middleware – attached to the router. Update the request, and sent it to the service
    • service – configure how to reach actual service. I wish they used different name here
    • providers – sources of configuration. Traefik will use them to discover services, routes, etc. Most popular options are k8s ingress, ingressroute (custom resource), docker (routing based on docker labels), or static file configuration

    Since traefik is shipped with k3s, we can skip the installation. For the basic configuration I enabled access log, dashboard and changed log level for debug.

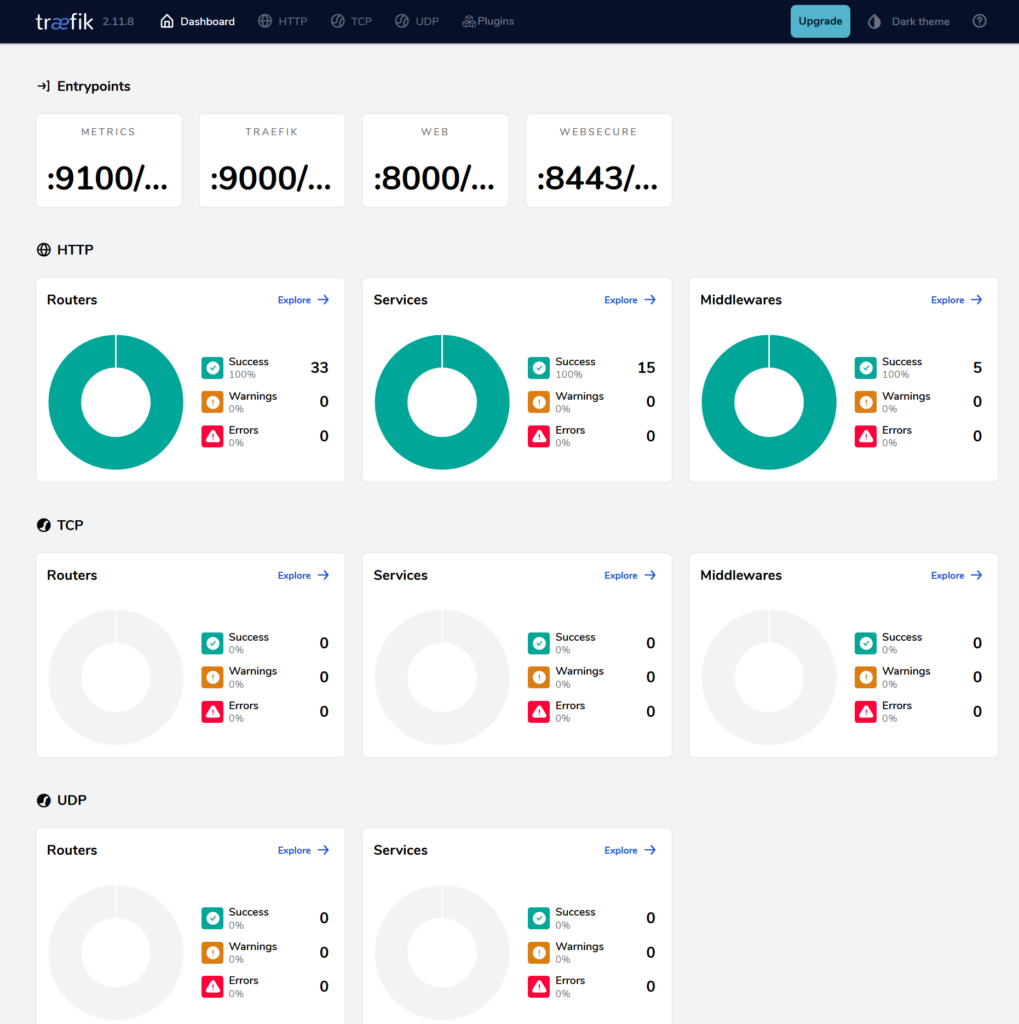
    The access log records details of requests processed by the http server or a proxy. Usually it has a form similar to this: timestamp, IP,http method, URL path, status code, response time. It is helpful for traffic analysis and troubleshooting. Traefik dashboard provides UI with visual representation of configured resources, like routers, services and middlewares.

    In k3s access log is disabled by default, as k3s is minimal kubernetes distribution, and enabling it can cause additional load for the cluster.

    The settings can be add either to /var/lib/rancher/k3s/server/manifests/traefik.yaml

    apiVersion: helm.cattle.io/v1
    kind: HelmChart
    metadata:
      name: traefik
      namespace: kube-system
    spec:
      chart: https://%{KUBERNETES_API}%/static/charts/traefik-25.0.3+up25.0.0.tgz
      set:
        global.systemDefaultRegistry: ""
      valuesContent: |-
        additionalArguments:
          - "--api"
          - "--api.dashboard=true"
          - "--api.insecure=true"
        deployment:
          podAnnotations:
            prometheus.io/port: "8082"
            prometheus.io/scrape: "true"

    or /var/lib/rancher/k3s/server/manifests/traefik-config.yaml

    apiVersion: helm.cattle.io/v1
    kind: HelmChartConfig
    metadata:
      name: traefik
      namespace: kube-system
    spec:
      valuesContent: |-
        logs:
          level: DEBUG
          access:
            enabled: true
            addInternals: false
            fields:
              defaultMode: keep

    Typically, changes are picked by helm immediately, and new instance is ready within a few seconds.

    When you enable access log, it will be flooded with api@internal calls. Most of them are health-checks that are generally unnecessary. The latest version of traefik has an option to filter them out with: addInternals: false but k3s has not adopted it yet. Workaround would be to add “–accesslog.filters.minDuration=1ms”, because most of those healthchecks are instantaneous.

    Before accessing the dashboard, create service:

    apiVersion: v1
    kind: Service
      labels:
        app.kubernetes.io/instance: traefik
        app.kubernetes.io/name: traefik-dashboard
      name: traefik-dashboard
      namespace: kube-system
    spec:
      ports:
      - name: traefik
        nodePort: 31904
        port: 9000
        protocol: TCP
        targetPort: traefik
      selector:
        app.kubernetes.io/instance: traefik-kube-system
        app.kubernetes.io/name: traefik
      sessionAffinity: None
      type: LoadBalancer

    Dashboard should be accessible at http://{{nodeIP}}:9000/dashboard/

    Next, add the internal DNS entry, and create the ingress:

    apiVersion: networking.k8s.io/v1
    kind: Ingress
    metadata:
      annotations:
        traefik.ingress.kubernetes.io/router.entrypoints: web,websecure
        traefik.ingress.kubernetes.io/router.tls: "true"
      creationTimestamp: "2024-11-13T18:47:20Z"
      generation: 1
      name: traefik
      namespace: kube-system
      resourceVersion: "2227725"
      uid: c56e65c7-637f-4d33-8cf8-44d99c91d7f5
    spec:
      ingressClassName: traefik
      rules:
      - host: traefik.piasecki.it
        http:
          paths:
          - backend:
              service:
                name: traefik-dashboard
                port:
                  number: 9000
            path: /
            pathType: Prefix
      tls:
      - hosts:
        - traefik.piasecki.it
    status:
      loadBalancer:
        ingress:
        - ip: 192.168.1.23
        - ip: 192.168.1.43

    I have mixed feelings about traefik. Is great versatile tool, that can cover many of the use cases. It is fast and do not consume a lot of cluster resources. However, configuration can be challenging. Documentation is not quite intuitive and require improvements. Most of the time, it works fantastically. But when issues do arise, troubleshooting can be slow and frustrating.

    + ,
  • Simulacra and Simulation

    Zachtronics

    Zachtronics is indie game studio founded in 2000 by Zach Barth. He studied systems engineering and computer science, and he has been creating video games since then. Through the years, he was polishing his idea, to incorporate programming, using fake assembly langue for a puzzle game.

    His most notable titles are:

    SpaceChem (2011)

    In this game you create complex molecules, by using visual programming language, and designing automated assembly lines.

    Opus Magnum (2017)

    His most popular title. You take role of the alchemist, who create products, according to the complex alchemy rules. For that purpose, you need to program range of different manipulators.

    Despite the title, the author does not consider it as his best work. He believes, that rules in the game put too much constrain on player creativity, and set of possible solutions is limited, compared to other titles. Indeed, putting an accent on variety set of different solutions is a common idea in Zachtronics games.

    Another game idea, that was implemented in couple of his games, is fake assembly language.

    TIS-100(2015)

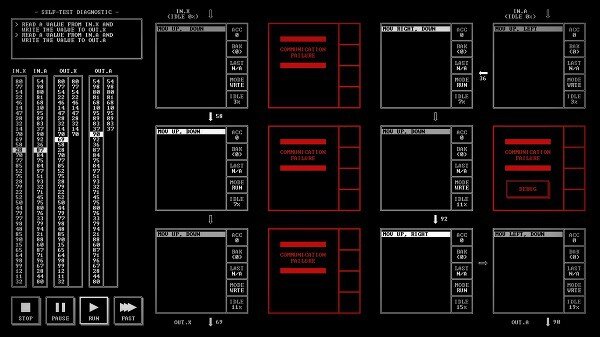
    In this game, your goal is to fix malfunctioning TIS-100 computer. It consist of 12 separate nodes. Each node has separate processor, and single register, for storing numerical values. Simplified assembly allows for basic operations, and transfering data to adjacent nodes. On later levels, your display is capable of displaying more colors (have not reached it yet :). As in other Zachtronincs games, after beating a level, you can see histogram comparing your solution to others, including CPU cycles, or total lines of code used. Another cool thing is a manual – opened for public:

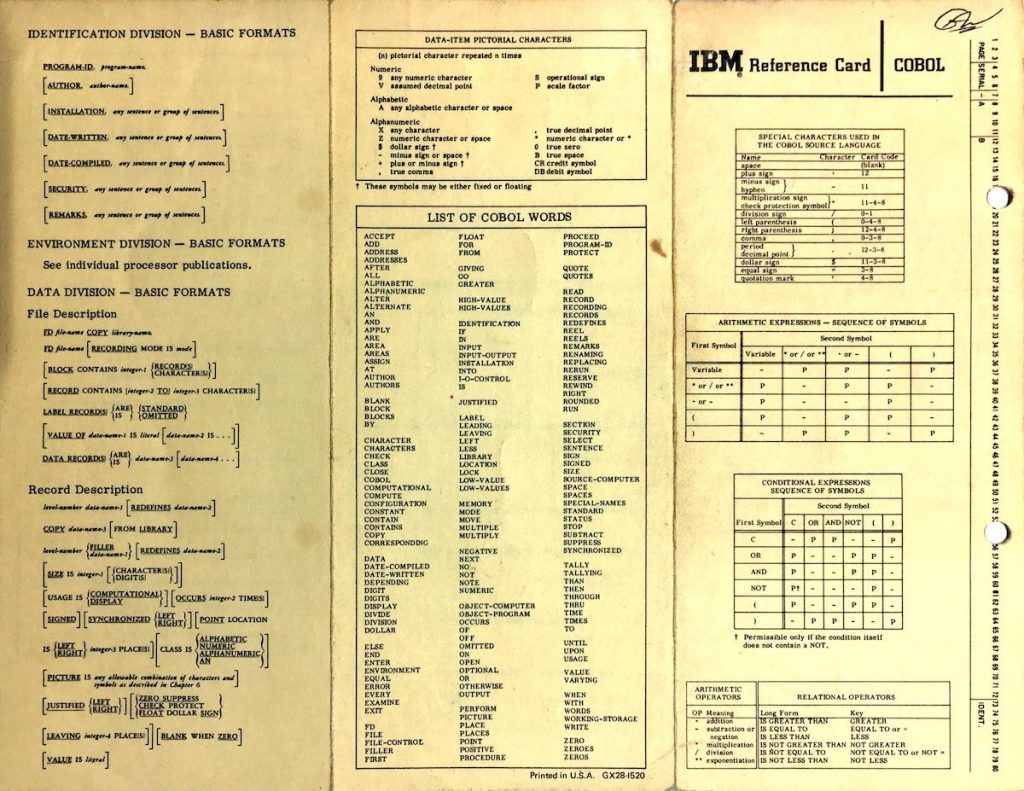
    https://www.zachtronics.com/images/TIS-100P%20Reference%20Manual.pdf

    It mimics old-school documentation like cobol.

    Anyway, it is a game that can teach programming, or discourage from learning it. Not entirely sure.

    Next game from this sub-genre was:

    Shenzhen I/O

    For those who do not know, Shenzhen is special economic zone, sometimes called “China Silicon Valley”

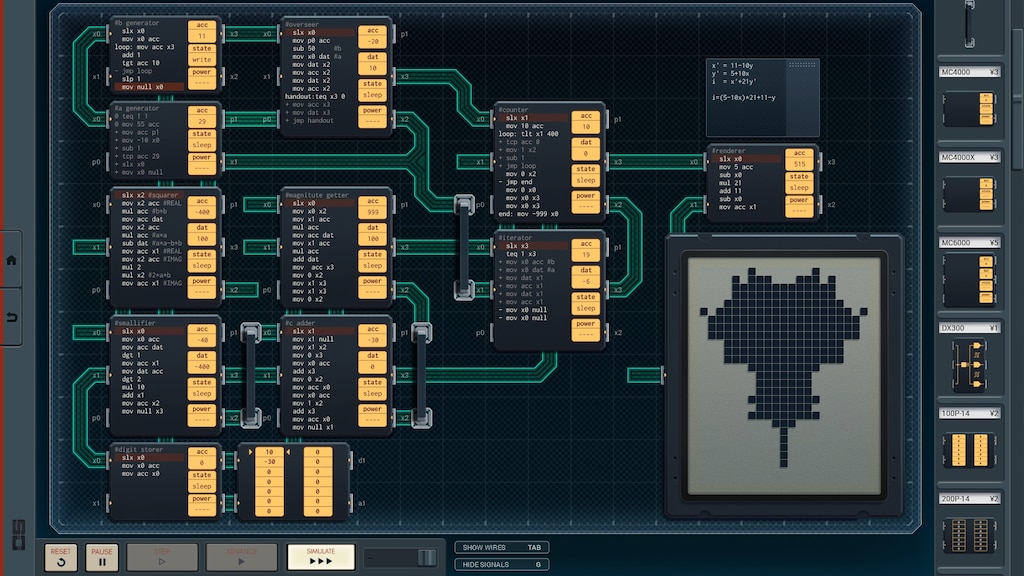
    In the game, we play as an engineer who works on tasks that involve placing different components and programming them. Again, we use a simplified assembly language, and our goal is to optimize either the cost or the CPU cycles. The game sometimes mocks the poor quality of Shenzhen products, or their attitude towards patents and licensing. But at the same time praise fast release cycle and lack of bureaucracy. As always, we have great puzzle game that require creativity, and adaptation when solving different problems. This time with perfect visual design. For the full immersion, game was supplied with a manual:
    https://github.com/JonathanLemke/shenzhen-io-translate/blob/master/SHENZHEN%20IO%20Manual%20(English).pdf that should be printed and put into binder. I believe, that those little brush touches make their game unique. I really appreciate when a designer put that much attention into the details.

    Exapunks(2018)

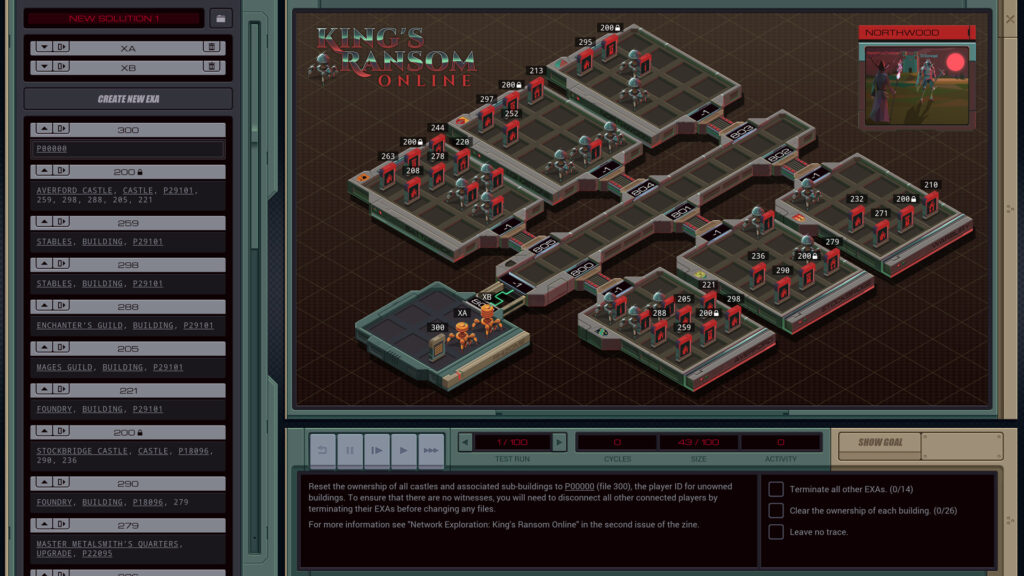
    Barth once said, that inspiration for the game was Stuxnet worm. This is fascinating story of virus created by United States and Israel, that targets PLC controllers used for separating nuclear material, required for nuclear program of Iran. When specific hardware configuration was found, virus was speeding up centrifuge to the point, where it was completely destroyed. According to Symantec, the virus spread to over 60% of all computers in Iran. Exapunks explore the idea of unfolding over the network, and attacking specific targets in some of the levels. The game is heavily inspired by cyberpunk genre, and takes place in cyberspace. Obligatory, we have hackers fighting with evil corporations, omnipotent AI and malfunctioning implants. Documentation is provided in form of hack zines, and unlocked through the game. Mechanic is slightly similar to other Zachtronics productions. We are using simplified assembly language to control our bots. They can manipulate files, read/write special registers, move through through the network, spawn other bots or kill them. There is a mini-game with auto-battler mechanic, where you can fight with other people. Points are given for tasks similar to capturing the flag or controlling the territory. This game by Zach Barth is top choice for me. It’s meticulously designed, polished in every detail, and set in my favorite sci-fi subgenre.

    Last Call BBS (2022)

    Their last game, is rather a series of mini-games. I have not tried it yet, but I bet is as original and perfectly executed, as every other title by them. As always, reception is super positive. Unfortunately, after releasing the title, the team disbanded. They claim, that they already achieved their goals, and frankly, I can believe it. They wanted to finish their work before the burnout. Zach shares his pure enthusiasm and dedication though his games. If he would lost that spark, by doing it for too long, his games would not be the same. Let me quote another review:

    “Aren’t computers cool?” his games ask. “And aren’t the programs they run cool? Isn’t hacking culture and cyberpunk stuff and science and engineering cool?”

    Even after creating own genre, and polishing it to the perfection, Barth is still humble guy. I remember, when my PC crashed during the save, leaving it corrupt. The launcher send crash report. I did not expect much. But within an hour, he fixed that save and sent me over e-mail. It was encoded using base64 and somehow he was able to recover it. Sadly, he will not make new titles. But what he left is truly awesome.

    +
  • Simulacra and Simulation

    Lets Encrypt wildcard cert + internal ingress

    Use case: certain services available only from home network, but still with subdomain and certificate, that all browsers will accept. For example UI for traefik or longorn – I would not necessarily share them outside. Of course you can use self-signed, but there is little inconvenience here and there. The idea is to get the wildcard certificate, and configure local DNS server with IP from private network range.

    To quickly recap, there are three classes of private IP ranges:

    • class A: 10.0.0.0 to 10.255.255.255, 16mln addresses
    • class B: 172.16.0.0 to 172.31.255.255, 1mln addresses
    • class C: 192.168.0.0 to 192.168.255.255, 65k addressees

    Those addresses are non routable, and require NAT.

    I started with creating another cluster issuer. Not sure why, but I had a problem with traefik solver. Maybe I am not that patient. But this time I created cloudflare solver. Using cloudflare API tends to be more reliable. Cert manager will use provided token for cloudflare API, and create TXT record.

    apiVersion: v1
    kind: Secret
    metadata:
      name: cloudflare-api-token-secret
      namespace: cert-manager
    type: Opaque
    stringData:
      api-token: "take it from your cloudflare account"
    apiVersion: cert-manager.io/v1
    kind: ClusterIssuer
    metadata:
      name: letsencrypt-prod-api
    spec:
      acme:
        email: mail@mail.pl
        server: https://acme-v02.api.letsencrypt.org/directory
        privateKeySecretRef:
          # Secret resource that will be used to store the account's private key.
          name: issuer-acct-key
        solvers:
        - dns01:
            cloudflare:
              email: mail@mail.pl
              apiTokenSecretRef:
                name: cloudflare-api-token-secret
                key: api-token
          selector:
            dnsZones:
            - 'example.com'
            - '*.example.com'

    Now, request wildcard certificate from LetsEncrypt.

    apiVersion: cert-manager.io/v1
    kind: Certificate
    metadata:
      name: wildcard-example-com
      namespace: kube-system
    spec:
      secretName: wildcard-example-com-tls
      issuerRef:
        name: letsencrypt-prod-api
        kind: ClusterIssuer
      dnsNames:
        - "*.example.com"

    Create those resources, and check for a minute or so. After that, your certificate should be ready. You can check the status with kubectl get cert -A

    Next step would be configuring traefik to use newly obtained certificate by default. In k3s it can be done by editing the helm chart values. The traefik will be redeployed automatically, after any changes in this file: /var/lib/rancher/k3s/server/manifests/traefik.yaml. But there is a better way. Traefik has CRD called TLSStore. Instead of redeploying the app, you can create such TLSStore and point to a secret with the certificate. It will be used as default.

    apiVersion: traefik.containo.us/v1alpha1
    kind: TLSStore
    metadata:
      name: default
      namespace: kube-system
    spec:
      defaultCertificate:
        secretName: my-default-cert-secret

    Now, add a local record to pihole. Unfortunately pihole UI do not accept multiple entries for a single domain. So first dirty hack would be creating similar entries, like service.domain and service2.domain and double the ingresses. There is another way, by editing /etc/dnsmasq.d/02-custom.conf. If you inspect pihole deployment, you will see:

            volumeMounts:
            - mountPath: /etc/pihole
              name: config
            - mountPath: /etc/dnsmasq.d/02-custom.conf
    (...)
          - configMap:
              defaultMode: 420
              name: pihole-custom-dnsmasq
            name: custom-dnsmasq

    It means, that we can modify this file, by editing custom-dnsmasq configmap.

    Add something like this, and delete the pod

    data:
      02-custom.conf: |
        addn-hosts=/etc/addn-hosts
        host-record=pihole.piasecki.it,192.168.1.23
        host-record=pihole.piasecki.it,192.168.1.43

    after that we can check if it is working:

    dig @192.168.1.23 pihole.piasecki.it                                                                                                             
    
    ;; ANSWER SECTION:
    pihole.piasecki.it.     0       IN      A       192.168.1.43
    pihole.piasecki.it.     0       IN      A       192.168.1.23

    Lastly, create ingress

    apiVersion: networking.k8s.io/v1
    kind: Ingress
    metadata:
      annotations:
        traefik.ingress.kubernetes.io/router.entrypoints: web,websecure
        traefik.ingress.kubernetes.io/router.tls: "true"
      name: pihole-web
      namespace: pihole
    spec:
      ingressClassName: traefik
      rules:
      - host: pihole.example.com
        http:
          paths:
          - backend:
              service:
                name: pihole-web
                port:
                  number: 80
            path: /
            pathType: Prefix
      tls:
      - hosts:
        - pihole.example.com

    finally, we can check if certificate is set up correctly

    
    openssl s_client -connect pihole.piasecki.it:443 -showcerts                                                                                
    CONNECTED(00000003)
    depth=2 C = US, O = Internet Security Research Group, CN = ISRG Root X1
    verify return:1
    depth=1 C = US, O = Let's Encrypt, CN = R11
    verify return:1
    depth=0 CN = *.piasecki.it
    verify return:1
    ---
    Certificate chain
     0 s:CN = *.piasecki.it
       i:C = US, O = Let's Encrypt, CN = R11
       a:PKEY: rsaEncryption, 2048 (bit); sigalg: RSA-SHA256
       v:NotBefore: Nov  5 20:38:06 2024 GMT; NotAfter: Feb  3 20:38:05 2025 GMT

    And it’s done. Frankly, it was much more problematic than I expected. Traefik logs are garbage. Debugging those issues would be much faster, If traefik would log something, when it encounter an issue with configuration. Anyway, I’m glad I documented it (to some degree). Hopefully, it will be useful to someone.

    + , ,
  • Simulacra and Simulation

    syncthing – replication for dummies

    Syncthing is decentralized file synchronization tool. Key difference between services like Dropbox is, that data never leaves your network, unless you explicitly configure it to do so.

    pros:

    • free and open source
    • flexible
    • more control over your data

    cons:

    • require setup and maintenance

    There can be many usecases for syncthing. For example:

    • Synchronize media among devices. For example accessing phone photos. Or removing phone files from another device.
    • Copying files from camera’s SD and making it available for everyone
    • Mirroring dot files. If you have similar environment across few devices, you can keep them aligned by synchronizing configuration.
    • Backup with versioning
    • Version control for those who refuse to use git
    • Migrating data from one device to another
    • Keeping Obsidian/Logseq notes in sync
    • etc

    I have not found helm chart for that, but deployment is not super complicated. Let’s start with pvc:

    apiVersion: v1
    kind: PersistentVolumeClaim
    metadata:
      name: syncthing-pv-claim
      labels:
        app: syncthing
    spec:
      accessModes:
        - ReadWriteOnce
      resources:
        requests:
          storage: 50Gi

    then deployment

    apiVersion: apps/v1
    kind: Deployment
    metadata:
      name: syncthing
      labels:
        app: syncthing
    spec:
      replicas: 1
      selector:
        matchLabels:
          app: syncthing
      strategy:
        type: Recreate
      template:
        metadata:
          labels:
            app: syncthing
        spec:
          nodeSelector:
          containers:
          - image: syncthing/syncthing:1.28
            name: syncthing
            resources:
              limits:
                memory: "256Mi"
                cpu: "500m"
            ports:
            - containerPort: 8384
              name: syncthing
              protocol: TCP
            - containerPort: 22000
              protocol: TCP
              name: to-listen
            - containerPort: 22000
              protocol: UDP
              name: to-discover
            volumeMounts:
            - name: syncthing-persistent-storage
              mountPath: /var/syncthing
          volumes:
          - name: syncthing-persistent-storage
            persistentVolumeClaim:
              claimName: syncthing-pv-claim
    

    and the service

    apiVersion: v1
    kind: Service
    metadata:
      name: syncthing-service
      labels:
        app: syncthing
    spec:
      ports:
        - name: http
          port: 32080
          targetPort: 8384
          protocol: TCP
        - protocol: TCP
          port: 32000
          targetPort: 22000
          name: to-listen
        - protocol: UDP
          port: 32000
          targetPort: 22000
          name: to-discover
      selector:
        app: syncthing
      type: NodePort

    Now we can access the UI using http port.

    We can split the configuration into two parts: Folders and Devices.

    Folder can be shared across many devices. It can work in three modes:

    • send only
    • receive only
    • send and receive

    It is quite important to choose correct option for your usecase. More advanced options are ignore patterns and file versioning.

    To finish basic configuration, add another device to the setup. Easiest would be install it on your phone. If you are using android, I would recommend this build: https://f-droid.org/pl/packages/com.nutomic.syncthingandroid/ . Unfortunately, recently it was removed from Google Play. The problem was with permissions. Tools like syncthing makes most sense when they have wide filesystem access. You could easly create backups of the whole device – if you know what you are doing. But Google decided that users should not give that kind of permissions to any application. When creating a folder using android app, you have a restriction what to share. For example, you can share Camera folder, but not Dowloads. But there is a hack for that. That restriction is enforced only by the “Folder picker” – gui element of the android. You can open WebUI, and edit existing folder, and share everything from your phone, by changing “DCIM/Camera” to something like “/storage/emulatd/0/DCIM”.

    I understand the general idea standing behind “protecting privacy”. I can imagine someone wiping their phone by an accident. But enforcing this for power users is annoying.

    + ,
  • Simulacra and Simulation

    pihole: DNS server with adblocking capabilities

    I was thinking abut setting internal docker registry. But for that, I need internally resolved domains. Pihole can help with that, and also have ad blocking as a feature, which is a nice bonus. As DNS server is crucial service, I would like to have two instances running in parallel. For that, lets add another node to the cluster:

    curl -sfL https://get.k3s.io | K3S_URL=https://192.168.1.43:6443 K3S_TOKEN=K10f7fe3706f8ad61462015f489812856e29847540612c63c6f9e21be60acdd5c91::server:64dc1263ede14dd1624b8bqf438a930f sh -

    Change IP of the master node, take the token from /var/lib/rancher/k3s/server/node-token . After few moments, new node will be ready

    kubectl get nodes                                                                                                                          
    NAME            STATUS   ROLES                  AGE    VERSION
    fedora-1.home   Ready    control-plane,master   16d    v1.30.5+k3s1
    raspberrypi     Ready    <none>                 126m   v1.30.6+k3s1

    If you are using longhorn, you can check longhorn-system namespace, if everything is running fine. In my case, I had to install open-iscsi on raspberry, after that everything was working correctly.

    kubectl get pods -l app=longhorn-manager -o custom-columns=NAME:.metadata.name,STATUS:.status.phase,NODE:.spec.nodeName -n longhorn-system 
    NAME                     STATUS    NODE
    longhorn-manager-q2zzz   Running   raspberrypi
    longhorn-manager-rd8dv   Running   fedora-1.home

    Now, I can install pihole

    helm repo add mojo2600 https://mojo2600.github.io/pihole-kubernetes/
    helm repo update

    But before installing helm chart, lets prepare values.yaml first. In my case it is:

    replicaCount: 2     
    serviceDns:         
      type: LoadBalancer  
    serviceDhcp:    
      enabled: false   
    persistentVolumeClaim: 
      enabled: true    
    accessModes:  
      - ReadWriteMany   
    adminPassword: "censored"   

    now, create namespace, change context and install pihole

    kubectl create namespace 
    kns pihole
    helm install pihole mojo2600/pihole --values values.yaml

    That chart will create couple of services

    k get svc                                                                                                                                  
    NAME             TYPE           CLUSTER-IP     EXTERNAL-IP                 PORT(S)                      
    pihole-dns-tcp   LoadBalancer   10.43.74.111   192.168.1.23,192.168.1.43   53:30233/TCP                 
    pihole-dns-udp   LoadBalancer   10.43.37.242   192.168.1.23,192.168.1.43   53:31238/UDP                 
    pihole-web       NodePort       10.43.250.12   <none>                      80:31808/TCP

    We can use the DNS right now:

    dig @192.168.1.43 wp.pl                                                                                                                    
    
    ;; ANSWER SECTION:
    wp.pl.                  150     IN      A       212.77.98.9

    And after carefully preparing some record from pihole web ui:

    dig @192.168.1.23 dupa666.com                                                                                                              
    
    ;; ANSWER SECTION:
    dupa666.com.            0       IN      A       6.6.6.6

    All it left is to update adlists, and your devices DNS servers.

    +
  • Simulacra and Simulation

    systemd timer -> k8s cronjob

    Why would I want to migrate the systemd timer job as a k8s cronjob? One could say, for better resilience and resource utilization in the cluster. Workloads will be scheduled for any available node, not only the one with the timer configured. However, the real reason is, because by doing unnecessarily complex stuff, people will think I am smart.

    Without further ado, let’s start with a Dockerfile. I want to containerize terraform job from previous post:

    FROM hashicorp/terraform:1.9
    
    WORKDIR /workspace
    COPY main.tf /workspace/main.tf
    
    ENTRYPOINT ["terraform"]

    Let’s build it, and push to the dockerhub. I know it is silly to push and pull from the dockerhub, but we do not have local registry yet – which makes good idea for the next post.

    Here is the general idea, how cronjob should look like:

    apiVersion: batch/v1
    kind: CronJob
    metadata:
      name: terraform-cloudflare-cronjob
    spec:
      schedule: "0 * * * *" 
      jobTemplate:
        spec:
          template:
            spec:
              containers:
              - name: terraform-cloudflare-container
                image: {{image}}:{{tag}}
                args: ["apply","--auto-approve"]
                volumeMounts:
                - name: vars-secret
                  mountPath: /workspace/vars.auto.tfvars
                  subPath: vars.auto.tfvars
                - name: terraform-workspace-storage
                  mountPath: /workspace/
    
              restartPolicy: OnFailure
    
              volumes:
              - name: vars-secret
                secret:
                  secretName: vars
              - name: terraform-workspace-storage
                persistentVolumeClaim:
                  claimName: terraform-pvc
    
    • schedule: it uses cron syntax, lets run it every hour for now
    • image: change it for your image
    • volume mounts: we need to create one secret, and one persistent volume claim

    To create a secret, save it as vars.auto.tfvars:

    cloudflare_api_token = ""
    zone_id = ""
    domains = ["domain","subdomain1","subdomain2"]

    and create secret from that file:

    kubectl create secret generic vars --from-file=vars.auto.tfvars  

    It will be mounted as a file, and terraform will read them automatically. There are two reasons we want to mount this file externally: security and ease configuration. Definitely do not share the api token with anyone. And by having external domain configuration, we can easily add and remove subdomains.

    Next, lets create pvc:

    apiVersion: v1
    kind: PersistentVolumeClaim
    metadata:
      name: terraform-pvc
    spec:
      accessModes:
        - ReadWriteOnce
      resources:
        requests:
          storage: 200Mi

    Last but not least, we need to run terraform init first. Easiest way would be just create one-shot pod for that. Definition would be quite similar. Only notable difference would be args for terraform command.

    apiVersion: v1
    kind: Pod
    metadata:
      name: terraform-cloudflare-pod
    spec:
      containers:
      - name: terraform-cloudflare-container
        image: {{image}}:{{tag}}
        args: ["init"]
        volumeMounts:
        - name: vars-secret
          mountPath: /workspace/vars.auto.tfvars
          subPath: vars.auto.tfvars
        - name: terraform-workspace-storage
          mountPath: /workspace/
    
      volumes:
      - name: vars-secret
        secret:
          secretName: vars
      - name: terraform-workspace-storage
        persistentVolumeClaim:
          claimName: terraform-pvc
    

    + ,