I run two AI coding assistants side by side: Claude Code as the primary driver, and Antigravity - CLI and IDE for Gemini models. Both are capped on rolling windows - five hours and a week. To manage that quota better I need a tool that visualizes and alerts me on quota usage. In my cluster I already have Prometheus and Grafana running, and I decided using them would be the best way to achieve it.
Claude Code OpenTelemetry exporter
Claude Code ships its own OpenTelemetry exporter for tokens, cost, and session counts - it’s off by default. Turning it on is just environment variables in ~/.claude/settings.json:
{
  "env": {
    "CLAUDE_CODE_ENABLE_TELEMETRY": "1",
    "OTEL_METRICS_EXPORTER": "otlp",
    "OTEL_EXPORTER_OTLP_ENDPOINT": "http://x.x.x.x:30418",
    "OTEL_EXPORTER_OTLP_PROTOCOL": "http/protobuf"
  }
}
That endpoint is a NodePort on an OTel Collector running in the cluster (otel-collector/), which fans metrics out to a Prometheus exporter. This alone gets me cost-per-day, token burn rate, and session counts.
The problem is that this OTel exporter doesn’t export the quota percentage - the most valuable information for me. That number only exists as text, printed when you run /usage interactively.
> claude -p "/usage"
You are currently using your subscription to power your Claude Code usage

Current session: 22% used · resets Jul 31, 7:29pm (Europe/Warsaw)
Current week (all models): 62% used · resets Aug 3, 12:59am (Europe/Warsaw)

What's contributing to your limits usage?
Approximate, based on local sessions on this machine — does not include other devices or claude.ai. Behaviors are independent characteristics, not a breakdown.

Last 24h · 308 requests · 5 sessions
  89% of your usage was at >150k context
  37% of your usage came from subagent-heavy sessions
  Top MCP servers: playwright 25%, antigravity-cli-mcp 11%

Last 7d · 1693 requests · 13 sessions
  81% of your usage was at >150k context
  60% of your usage came from subagent-heavy sessions
  53% of your usage came from sessions active for 8+ hours
  Top skills: /graphify 1%
  Top subagents: graphify 7%
  Top MCP servers: playwright 7%, antigravity-cli-mcp 5%
Above is sample output. I’m interested in the first 3 lines of it.
I decided to grab that information using brute force. I created a CronJob that does exactly that every 5 minutes:
result = subprocess.run(['claude', '-p', '/usage'], capture_output=True, text=True, check=True)After parsing the output with regex, I send the quota usage to the OTel endpoint. The only problem I had to solve was credentials. Initially I provided them as a secret, but they need to be refreshed periodically, so new versions are stored on a PVC.
Antigravity exporter
With Antigravity, the situation is even worse. It doesn’t provide a handy command like claude -p /usage. Instead, I had to execute and parse the TUI… It doesn’t seem like a good idea, but eventually it worked. I wrapped it in a similar CronJob to Claude Code’s, and set the timer to execute every 5 minutes. After all that trouble I ended up with 6 metrics in Prometheus: Claude Code 5h and 7d quota, Gemini 5h and 7d quota, and Claude Code + ChatGPT 5h and 7d quota - provided by Gemini as well.
orest@tuxedo:~$ curl -s 'http://x.x.x.x:9999/api/v1/query?query=claude_pro_session_percentage' | jq
{
  "status": "success",
  "data": {
    "resultType": "vector",
    "result": [
      {
        "metric": {
          "__name__": "claude_pro_session_percentage",
          "container": "otel-collector",
          "endpoint": "metrics",
          "exported_job": "claude-quota-exporter",
          "instance": "10.42.0.134:8889",
          "job": "otel-collector",
          "namespace": "otel-collector",
          "pod": "otel-collector-6cd94474d8-8d95n",
          "service": "otel-collector"
        },
        "value": [
          1785509792.133,
          "20"
        ]
      }
    ]
  }
}
In this example, the value field is a 2-value pair: timestamp and percentage used.
Grafana dashboard
Having all that info in Prometheus, I started working on a Grafana dashboard. I wanted to show token burn rate and quota reset time. But the problem was that quota reset is a future date, and sending a future event isn’t possible in Prometheus. But I found a good workaround - Grafana annotations.
Grafana has its own annotation store, separate from Prometheus, and it can render a marker at any timestamp - past or future. The script writes one annotation per panel every run, via Grafana’s REST API:
def upsert_grafana_annotations(session_reset_ts, week_reset_ts):
    for tag, panel_id, reset_ts, label_base, fallback_window in panels:
        tag_full = f"quota-reset-{tag}"

        # delete the stale annotation for this tag before writing a fresh one
        existing = _grafana_request('GET', f'/api/annotations?tags={tag_full}&limit=100')
        for ann in existing:
            _grafana_request('DELETE', f"/api/annotations/{ann['id']}")

        future_ms = int(reset_ts * 1000) if reset_ts else int((now + fallback_window) * 1000)
        _grafana_request('POST', '/api/annotations', {
            'dashboardUID': DASHBOARD_UID,
            'panelId': panel_id,
            'time': future_ms,
            'tags': ['quota-reset', tag_full],
            'text': label_base,
        })
A few things that made this work reliably:
For make it work, I had to setup grafana service account with editor role, its token is passed to the CronJob.
Usage delta
A flat “62% used” doesn’t tell you if that’s fine or alarming - it depends how much of the window has elapsed. 62% used with 90% of the week gone is nothing to worry about; 62% used with 10% of the week gone is a problem. I wanted a single number for that.
I tried different solutions, but finally landed on an idea borrowed from burndown charts: remaining% − time_remaining%. 40% quota left with 80% of the week still to go is 40 − 80 = −40 - you’re behind.
The dashboard
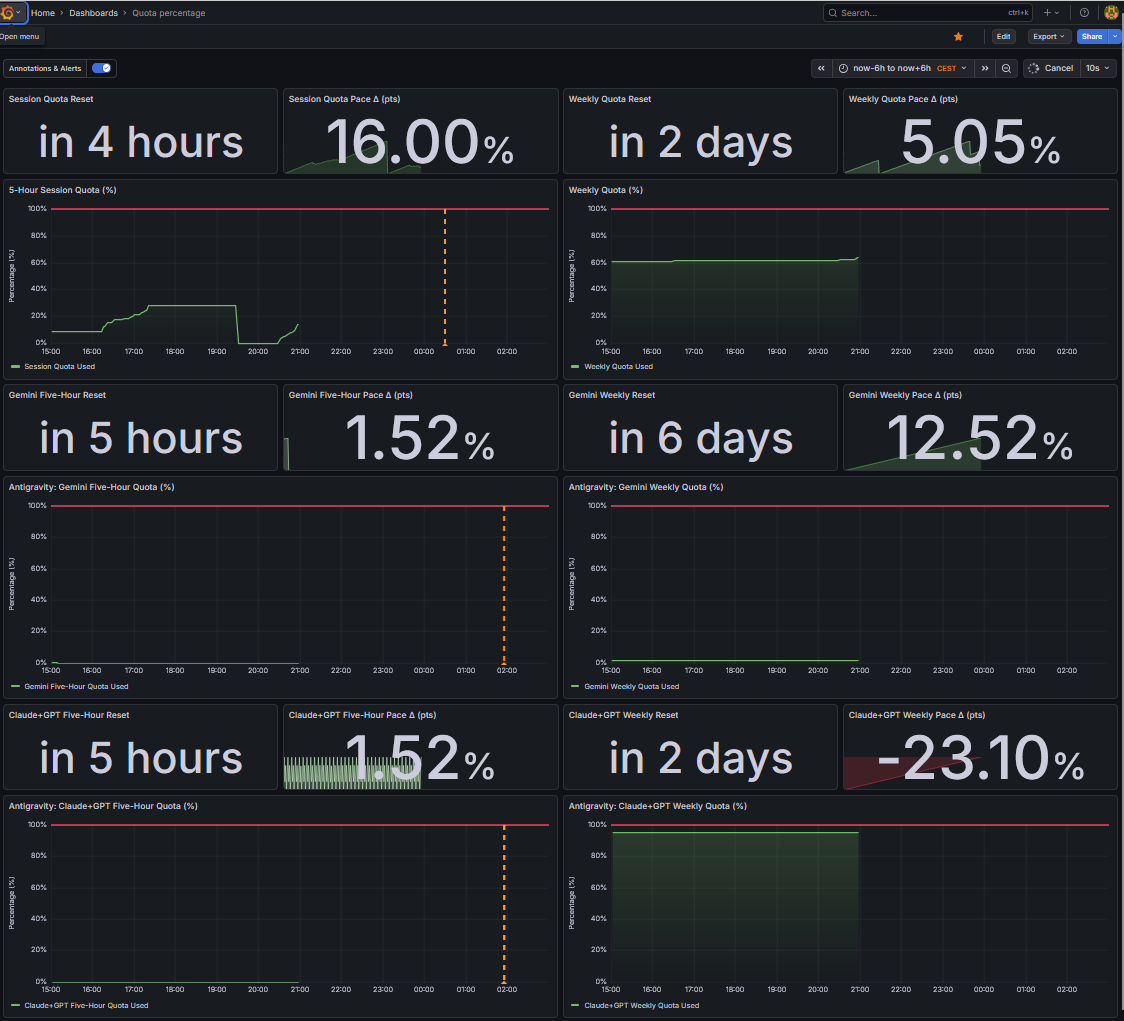
All of it lands on one Grafana dashboard: gauges for current usage, stat panels counting down to the next reset, and the Pace Δ panels, split across the three pools and their five-hour/weekly windows.
Next steps
In the future I would like to use this data to implement orchestrator-worker pattern. Heavy/expensive model will be dispatching work to cheaper models based on the quota left, and then synthesizing the results. Some tasks - like searching the web - can be easly offloaded to Gemini. When getting responses for fairly easy questions, orchestrator can call agents multiple times and get “multi call consensus”. All of this has researched. I would like to to create quota/budget aware orchestration. Adding local GPU to the mix will make it even more interesting.