In k3s, traefik is the default ingress controller. It handles incoming HTTP and HTTPS requests and routes them to correct services. If you have multiple domains, subdomains, or need to route different paths to different services, Traefik is an excellent choice.
Traefik is a reverse proxy, meaning it is acts as a backend server for the end user, routing client requests to the appropriate services.
In contrast, a forward proxy acts on behalf of the client, typically for privacy or content filtering.
There are various of choices for reverse-proxy and ingress controllers for k8s.
Among them nginx and traefik are most common choices. Both of them supports advanced routing, SSL termination and WebSockets. The key differences are:
- traefik was designed as a cloud-native tool, whereas nginx has a long history of general-purpose web server
- traefik is fully dynamic, and picks up the changes nearly instantly, while nginx requires reloading
- traefik includes dashboard and prometheus integration out of the box, nginx requires additional setup for those features
- the traefik documentation can be challenging to navigate, making the learning curve steeper compared to nginx.
Other noteworthy ingress controllers:
- HAProxy – for its high performance and advanced load-balancing capabilities, making it an excellent choice for handling heavy traffic
- Istio – part of the Istio service mesh, ideal for managing advanced traffic in microservice architecture
- AWS, GCP, Azure ingress controllers – integrates with their respective cloud resources, such as load balancers or application firewalls
Before starting any traefik configuration, it is helpful to understand the key concepts.
- entrypoint – a port that receives the traffic
- router – connects requests from the entrypoint to the service. Can use
middlewareto modify the request, before passing to the service - rule – part of the router. Defines criteria to route requests to the appropriate service. Rule can evaluate headers, hostnames, paths, IPs, etc.
- middleware – attached to the
router. Update the request, and sent it to theservice - service – configure how to reach actual service. I wish they used different name here
- providers – sources of configuration. Traefik will use them to discover services, routes, etc. Most popular options are k8s ingress, ingressroute (custom resource), docker (routing based on docker labels), or static file configuration
Since traefik is shipped with k3s, we can skip the installation. For the basic configuration I enabled access log, dashboard and changed log level for debug.
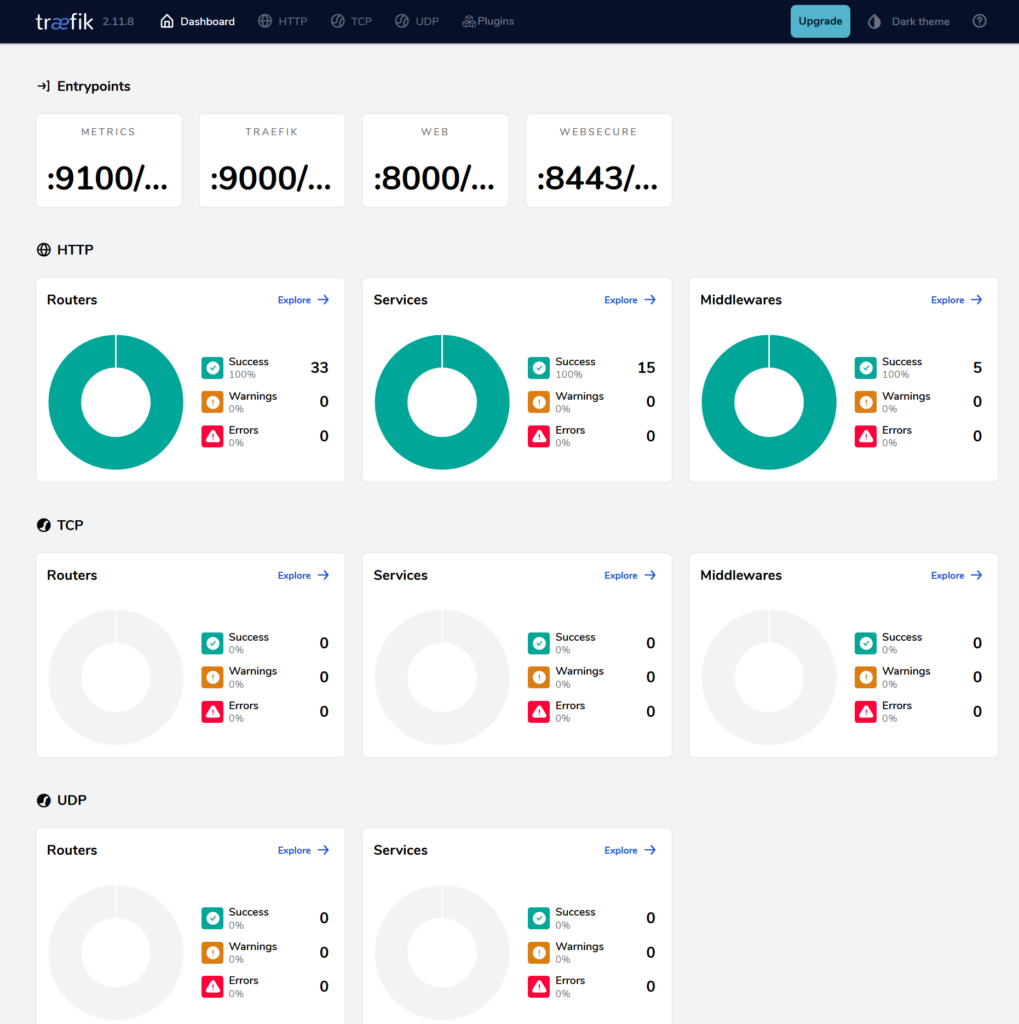
The access log records details of requests processed by the http server or a proxy. Usually it has a form similar to this: timestamp, IP,http method, URL path, status code, response time. It is helpful for traffic analysis and troubleshooting. Traefik dashboard provides UI with visual representation of configured resources, like routers, services and middlewares.
In k3s access log is disabled by default, as k3s is minimal kubernetes distribution, and enabling it can cause additional load for the cluster.
The settings can be add either to /var/lib/rancher/k3s/server/manifests/traefik.yaml
apiVersion: helm.cattle.io/v1
kind: HelmChart
metadata:
  name: traefik
  namespace: kube-system
spec:
  chart: https://%{KUBERNETES_API}%/static/charts/traefik-25.0.3+up25.0.0.tgz
  set:
    global.systemDefaultRegistry: ""
  valuesContent: |-
    additionalArguments:
      - "--api"
      - "--api.dashboard=true"
      - "--api.insecure=true"
    deployment:
      podAnnotations:
        prometheus.io/port: "8082"
        prometheus.io/scrape: "true"
or /var/lib/rancher/k3s/server/manifests/traefik-config.yaml
apiVersion: helm.cattle.io/v1
kind: HelmChartConfig
metadata:
  name: traefik
  namespace: kube-system
spec:
  valuesContent: |-
    logs:
      level: DEBUG
      access:
        enabled: true
        addInternals: false
        fields:
          defaultMode: keep
Typically, changes are picked by helm immediately, and new instance is ready within a few seconds.
When you enable access log, it will be flooded with api@internal calls. Most of them are health-checks that are generally unnecessary. The latest version of traefik has an option to filter them out with: addInternals: false but k3s has not adopted it yet. Workaround would be to add “–accesslog.filters.minDuration=1ms”, because most of those healthchecks are instantaneous.
Before accessing the dashboard, create service:
apiVersion: v1
kind: Service
  labels:
    app.kubernetes.io/instance: traefik
    app.kubernetes.io/name: traefik-dashboard
  name: traefik-dashboard
  namespace: kube-system
spec:
  ports:
  - name: traefik
    nodePort: 31904
    port: 9000
    protocol: TCP
    targetPort: traefik
  selector:
    app.kubernetes.io/instance: traefik-kube-system
    app.kubernetes.io/name: traefik
  sessionAffinity: None
  type: LoadBalancer
Dashboard should be accessible at http://{{nodeIP}}:9000/dashboard/
Next, add the internal DNS entry, and create the ingress:
apiVersion: networking.k8s.io/v1
kind: Ingress
metadata:
  annotations:
    traefik.ingress.kubernetes.io/router.entrypoints: web,websecure
    traefik.ingress.kubernetes.io/router.tls: "true"
  creationTimestamp: "2024-11-13T18:47:20Z"
  generation: 1
  name: traefik
  namespace: kube-system
  resourceVersion: "2227725"
  uid: c56e65c7-637f-4d33-8cf8-44d99c91d7f5
spec:
  ingressClassName: traefik
  rules:
  - host: traefik.piasecki.it
    http:
      paths:
      - backend:
          service:
            name: traefik-dashboard
            port:
              number: 9000
        path: /
        pathType: Prefix
  tls:
  - hosts:
    - traefik.piasecki.it
status:
  loadBalancer:
    ingress:
    - ip: 192.168.1.23
    - ip: 192.168.1.43
I have mixed feelings about traefik. Is great versatile tool, that can cover many of the use cases. It is fast and do not consume a lot of cluster resources. However, configuration can be challenging. Documentation is not quite intuitive and require improvements. Most of the time, it works fantastically. But when issues do arise, troubleshooting can be slow and frustrating.
Leave a Reply